Not too long ago, I made a blog entry, Request for Information - Physical Comparison of Humans to Animals I actually did receive some feedback in the form of e-mail, which inspired me to do more research. In the course of which, I found the paper, Differential scaling of locomotor performance in small and large terrestrial mammals, written by Jose (Pepe) Iriarte-Diaz, which was published in the JOURNAL OF EXPERIMENTAL BIOLOGY, 205 (18): 2897-2908 SEP 2002. Anyway, as part of his research into animal locomotion, he had compiled a large set of data of mammal max running speeds along with their body mass and length. This was exactly the type of thing I was looking for in order to characterize how humans compare to other animals.
To recap what it was that got me interested in this in the first place - After years of watching nature documentaries on PBS and the Discovery Channel, you get the impression that humans are pathetic when compared physically to other animals, and that our success was due mainly to our big brains and cleverness. While I'm not arguing against the adaptablity those attributes have given us, about a year ago, I read about a study called "Endurance running and the evolution of Homo", written by Dennis M. Bramble & Daniel E. Lieberman (Nature 432:345-352), comparing humans to other animals in endurance running, and we actually compare quite favorably.
There is a very good summary of the study by PZ Meyers on his Pharyngula Arhcive, and another good one at the UCI Biomechanics site.
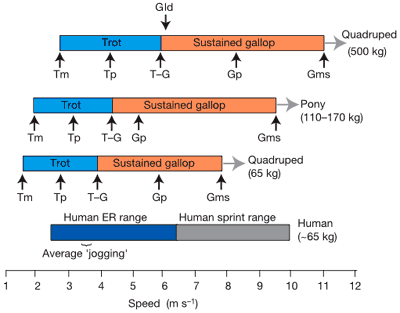
Since the above two pages cover the article very well, I won't go into it in much detail. But to give what I think is the "money shot" from the paper, below is a graph showing human running speeds compared to another good long distance runner, horses:
 Comparative ER performance in humans and quadrupeds. Range of speeds for human ER and sprinting, and minimum trot (Tm), preferred trot (Tp), trot–gallop transition (T–G), preferred gallop (Gp), and maximum sustained gallop (Gms) for ponies (ref. 26), and predicted for quadrupeds of 65 and 500 kg (ref. 25). Also indicated is Gld, the optimal long distance (,20 km), daytime galloping speed for horses (ref. 27). Note that quadrupeds sprint at speeds above Gms.
And here's a quote from PZ Meyers on his blog entry that I thinks puts our endurance running capabilities into good perspective, "Human ER [endurance running, i.e. still aerobic] speeds fall between 2.3 m s-1 (I must be somewhere around there) and 6.5 m s-1 (for an Olympic class marathoner), with typical speeds for a moderately fit jogger of 3.2-4.2 m s-1. In comparison, the trotting speed of a horse is about 3.1 m s-1, and once they hit 4.4 m s-1, they break into an anaerobic gallop. Over long distances, the average speed sustained by a horse is about 5.8 m s-1—which means that a well-trained, conditioned human being can keep up with or even outrun a horse if the race is sustained long enough."
So, as far as long distance running goes, humans can hold their own pretty well. But the popular sentiment seems to be that we're still lousy as far as sprinting goes, and that's where Pepe's paper comes in. Pepe's data compiled in the paper contained body mass, body length, and maximum relative running speed for each animal, where the relative running speed was defined as body lengths per second. In order to keep the trends relevant for running (to quote part of his paper), "Species with highly specialised habits and limb morphologies, such as arboreal and fully fossorial species, were excluded from the analysis."
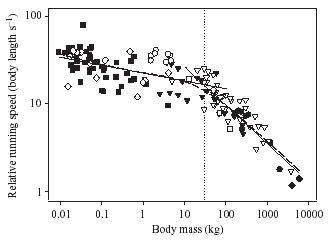
One of his major results was to show that maximum relative running speed decreases with increased body mass, and to comue up with a trend describing the relationship.
 Fig. 1. Maximum relative running speed of 142 species of mammals. Dashed line represents the LOWESS non-parametric smoothed regression fit (sampling proportion=0.6). Dotted line indicates the point of slope change (k=30 kg) in the one point-change regression model. Solid lines represents the fit under the ordinary least-squares method (OLS) for small and large mammals. Filled squares, Rodentia; open squares, Primata; filled diamonds, Proboscidae; open diamonds, Marsupialia; filled triangles, Carnivora; open triangles, Artiodactyla; filled circles, Perissodactyla; open circles, Lagomorpha.
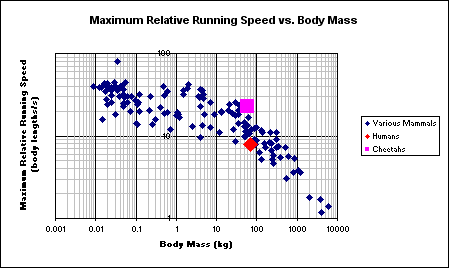
Since his data was "maximum" running speed, it was exactly what I was looking for to compare human sprinting abilities with other animals in general, and not just comparing us to the fastest like documentaries commonly do. I took his data and input it into Excel, so I could do my own playing around with it. First was to reproduce his graph, to make sure I'd input the data properly. On my version of the graph, I've highlighted humans, so you can see where we fall. I've also highlighted the most famous of all sprinters, the cheetah.

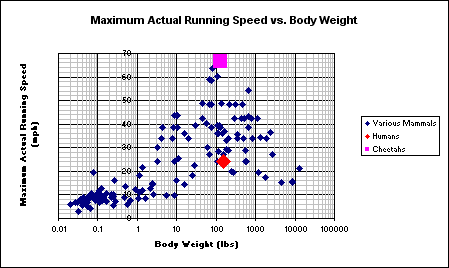
Next, I took his figures for body length and maximum relative running speed, and calculated a maximum actual running speed. For this graph, I converted speed to mph, and body weight to pounds (since I'm an engineer, not a scientist, and these units make the data easier for me to grasp). Once again, I've highlighted humans and cheetahs.

So, after looking at the data this way, while humans are definitely at the low end of the range, we're certainly not outliers in the data. We fit in comfortably compared to other animals, actually sprinting faster than a few of the animals in our weight class. Taking into account our endurance running capabilities, I'd say that humans really aren't too bad of runners, after all.
I guess next it's time to try to compare us to the other animals in other ways, such as our senses, or maybe our strength. If it takes me as long to research another one as my blog entries typically take, expect another update in a few years.


