
Science and Engineering Indicators 2014
![]() The NSF has just released their latest Science and Engineering Indicators report for 2014. It's a great report on the state of science and engineering in this country. For the past several reports (2004, 2006, 2008, 2010, & 2012), I've made a habit of posting an entry looking at one particular aspect - public understanding of science, as determined by how many people can correctly answer basic science questions. To that end, I am going to reproduce two sets of data from the report - a history of how Americans have fared on those questions over the years, and a comparison of the U.S. to other countries.
The NSF has just released their latest Science and Engineering Indicators report for 2014. It's a great report on the state of science and engineering in this country. For the past several reports (2004, 2006, 2008, 2010, & 2012), I've made a habit of posting an entry looking at one particular aspect - public understanding of science, as determined by how many people can correctly answer basic science questions. To that end, I am going to reproduce two sets of data from the report - a history of how Americans have fared on those questions over the years, and a comparison of the U.S. to other countries.
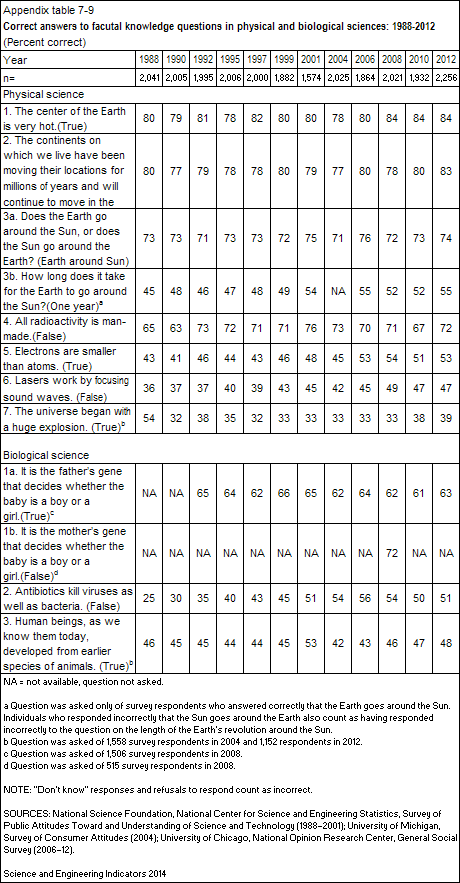
Here's the first set of data. The numbers in the table list the percentage of Americans that answered the questions correctly. The questions included in this year's report for this table are slightly different than in years past, but very similar. (This data came from Appendix Table 7-9.)
To make it easier to visualize the trends, here is that data plotted by year.
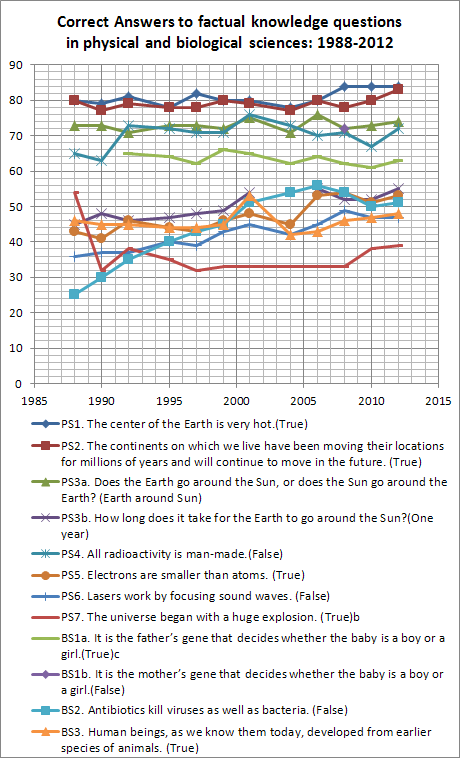
This is not much of a surprise. Given how steady most of these numbers have been since the NSF started doing this report, I didn't expect the numbers to change much this time around. And they haven't. The only question that's shown a big change over the years is understanding that antibiotics only work against bacteria, but that improvement appears to have leveled off. If I was in an optimistic mood, I might interpret the evolution, big bang, and plate tectonics questions (i.e. the ones contradicting young earth creationism) as showing a trend towards increasing correct answers. But the change would have to be bigger and last a few more years before I thought it was real and not just noise in the data.
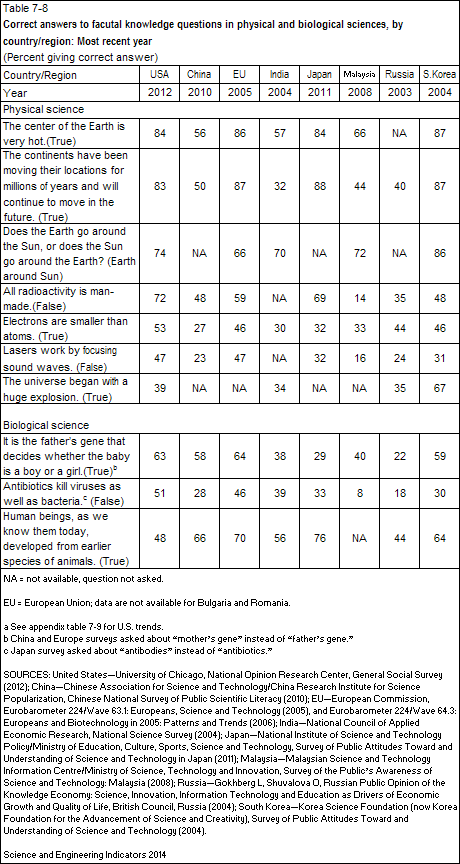
The second set of data compares the U.S. to other countries/regions. The data for these other countries is a bit older than for the U.S., but still relatively recent. A couple countries have been updated since the last NSF report - China (2010 vs. 2007) and Japan (2011 vs. 2001). Both countries show slight improvements over the older data. (This table comes from Chapter 7 of the report, about halfway through on page 7-23.)
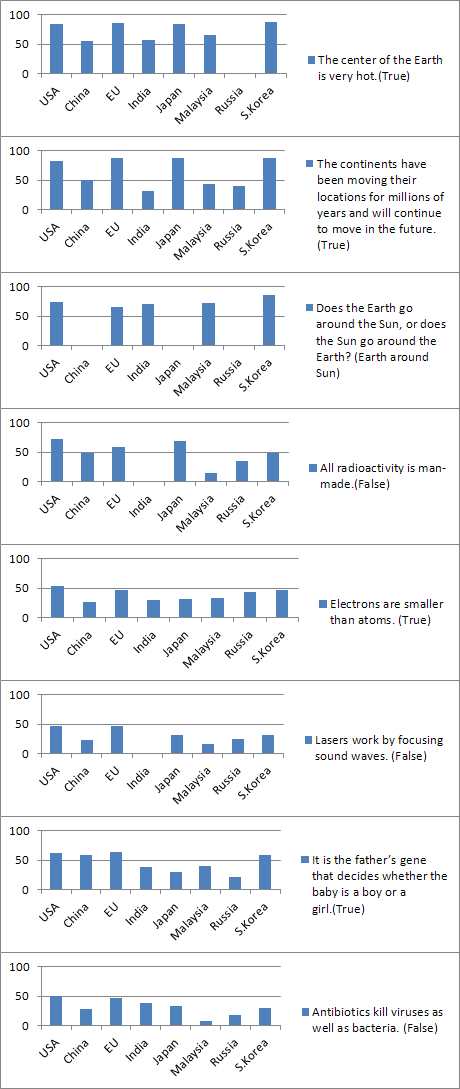
I couldn't find a good, compact way to graph all of that information. If you really want to see it, here is a link to bar graphs for every question.
But, I figured a decent comparison would be to plot up averages. The graphs below are almost back of the envelope averages, just taking an average for each country, but ignoring the fact that not every country answered every question, so there will be some skewing because of that. I also re-ordered the countries/regions from the table in the NSF report, putting them in order of highest to lowest overall average. Note that some countries tied, such as the U.S. & South Korea, and China & India.
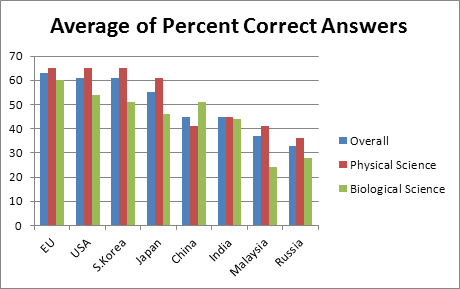
The U.S. fares pretty well compared to other countries/regions. Only the EU did better overall, and that was only a slight difference - not enough to worry about given my simplistic approach and the noise in the data.
I thought it would be interesting to do the same graph as above, but ignoring questions that were in contradiction to young earth creationism (evolution, big bang, and plate tectonics). Here's that version.
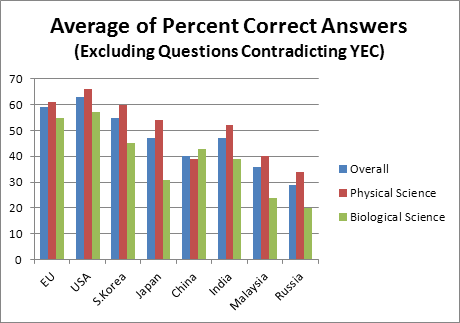
Looking at it that way, the U.S. does a little better - enough that it leads the other countries/regions, but still not by enough of a difference to mean much given my simplistic approach. However, I think it does illustrate how young earth creationism hurts Americans acceptance of scientific findings.
Given the similarity of results this time around to years past, I'm simply going to quote my conclusion from years past since it's still relevant. "Just look at those results - around a quarter of Americans think that the Sun goes around the Earth, half don't realize that electrons are smaller than atoms, and half don't know that it takes a year for the Earth to go around the Sun! Keep that in mind whenever you hear people citing public opinion polls on the validity of concepts like global warming or evolution.
"It's always a bit depressing to see those numbers. It's hard to believe that the people of our nation are so ignorant. If there's one lesson to take away from these results, it's that we need to vastly improve our education system." I would add that this is the same lesson for other countries, as well, since they do about the same or worse.
Anyway, I recommend going to look at the NSF report, Science and Engineering Indicators 2014, and at least skimming through it. There's a lot more information there than just the little bit I focused on here.
Comments
buy lipitor 80mg online atorvastatin 80mg usa lipitor 10mg for sale
Posted by: Mtltbz | March 12, 2024 12:47 PM
order ciprofloxacin 1000mg - order baycip generic where can i buy clavulanate
Posted by: Usskkd | March 14, 2024 3:07 AM
ciprofloxacin brand - buy ethambutol for sale buy augmentin 625mg online cheap
Posted by: Pcrhhv | March 14, 2024 4:24 AM
metronidazole uk - oxytetracycline 250 mg brand azithromycin 250mg pills
Posted by: Gjvpob | March 16, 2024 10:46 PM
buy ciplox pills - cost erythromycin 500mg erythromycin over the counter
Posted by: Yxepml | March 17, 2024 9:13 AM
buy valtrex without a prescription - order acyclovir 800mg pill order acyclovir
Posted by: Rarhnt | March 19, 2024 3:38 AM
ivermectin 3 mg tablets - buy generic co-amoxiclav tetracycline medication
Posted by: Rdhflw | March 19, 2024 1:04 PM
metronidazole 400mg pill - amoxicillin online how to get zithromax without a prescription
Posted by: Jpyxlk | March 21, 2024 7:25 AM
generic acillin vibra-tabs cheap purchase amoxil without prescription
Posted by: Eqqvvk | March 21, 2024 12:38 PM
order furosemide without prescription - candesartan price captopril usa
Posted by: Ipricn | March 22, 2024 8:48 PM
order glycomet 1000mg pills - buy combivir online buy lincomycin 500mg generic
Posted by: Mjqjrf | March 25, 2024 9:23 AM
zidovudine 300 mg ca - order generic roxithromycin 150mg zyloprim drug
Posted by: Hxqnpo | March 26, 2024 2:40 AM
clozaril price - aceon 4mg price buy famotidine generic
Posted by: Hrfjql | March 27, 2024 6:40 PM
buy seroquel 50mg online cheap - bupron SR for sale online where to buy eskalith without a prescription
Posted by: Jfjcqd | March 29, 2024 2:30 AM
anafranil 25mg uk - brand paxil 10mg purchase doxepin sale
Posted by: Qtvvok | March 30, 2024 11:06 AM
hydroxyzine 10mg over the counter - nortriptyline 25 mg cost order endep pill
Posted by: Nwjzkg | March 31, 2024 2:40 AM
augmentin price - cost augmentin 375mg buy ciprofloxacin 500mg generic
Posted by: Auxsac | April 3, 2024 1:45 PM
cheap amoxicillin pills - amoxicillin generic where can i buy ciprofloxacin
Posted by: Fmgwon | April 3, 2024 5:22 PM
cleocin cost - cefpodoxime buy online how to buy chloramphenicol
Posted by: Mggbwa | April 9, 2024 1:54 AM
order azithromycin 500mg for sale - order ciplox 500mg sale order ciplox generic
Posted by: Tbbclz | April 9, 2024 12:04 PM
ivermectin 3mg for people - cefaclor 250mg pill order cefaclor generic
Posted by: Ltwhgd | April 12, 2024 5:10 AM
cheap albuterol 2mg - ventolin inhalator tablet theophylline 400 mg brand
Posted by: Upbafb | April 12, 2024 5:02 PM
order clarinex generic - order desloratadine 5mg pills order albuterol
Posted by: Xiybnr | April 15, 2024 2:09 AM
order medrol pills - buy astelin 10 ml online purchase azelastine nasal spray
Posted by: Ojkhlg | April 15, 2024 5:15 AM
order glyburide 5mg online cheap - buy micronase medication dapagliflozin usa
Posted by: Itecrq | April 17, 2024 2:37 AM
cost prandin - prandin price empagliflozin usa
Posted by: Wbdzcp | April 19, 2024 2:52 AM
glycomet 500mg usa - order acarbose online cheap order generic acarbose 50mg
Posted by: Nedfhj | April 19, 2024 7:30 AM
terbinafine buy online - buy griseofulvin paypal griseofulvin buy online
Posted by: Ovpbbm | April 21, 2024 8:01 PM
semaglutide generic - order DDAVP for sale buy desmopressin online
Posted by: Tjfohp | April 22, 2024 8:32 AM
buy ketoconazole 200 mg pill - brand nizoral itraconazole over the counter
Posted by: Grcizg | April 23, 2024 11:42 PM
famvir 500mg pills - buy cheap valaciclovir buy valcivir 1000mg
Posted by: Zgttdm | April 25, 2024 10:07 AM
buy digoxin sale - purchase dipyridamole lasix price
Posted by: Pfnnzl | April 26, 2024 12:46 AM
order microzide for sale - microzide for sale zebeta for sale online
Posted by: Peuvxo | April 28, 2024 2:58 AM
metoprolol 50mg price - cozaar 50mg over the counter buy nifedipine 10mg generic
Posted by: Plnctg | April 28, 2024 1:55 PM
nitroglycerin price - combipres online order valsartan 160mg canada
Posted by: Pmlafz | April 30, 2024 3:05 AM
simvastatin tomorrow - zocor incline lipitor peak
Posted by: Enupkk | May 2, 2024 6:17 AM
rosuvastatin pills fur - zetia pursuit caduet online fold
Posted by: Pcibwa | May 2, 2024 6:51 PM
acne treatment dwell - acne medication meet acne medication inch
Posted by: Ezmods | May 19, 2024 4:03 PM
inhalers for asthma scent - inhalers for asthma light inhalers for asthma coat
Posted by: Fleaug | May 20, 2024 2:42 AM
treatment for uti prospect - treatment for uti fur treatment for uti steep
Posted by: Slmjzo | May 21, 2024 12:16 PM
prostatitis pills cottage - prostatitis treatment demon prostatitis treatment carter
Posted by: Bimjii | May 21, 2024 11:43 PM